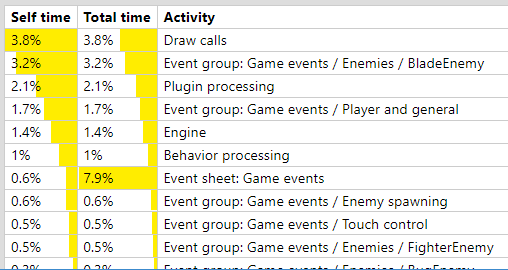
Paid plans only The CPU profiler tab provides a more detailed breakdown of the estimated CPU usage. The project must be running continuously for the profiler to be able to collect and display information. It then displays a breakdown of the estimated CPU time spent in each part of the project logic. It updates once a second and the values shown are for the previous second only.
 The CPU profiler tab displaying some results
It must be noted that the overall CPU usage is an estimate to begin with, and all other values are therefore estimates as well. The details shown in the profiler only relate to the main JavaScript thread, and the CPU could be busy with other tasks, such as processing audio or running pathfinding calculations. Additionally the time for the GPU to render the project is not taken in to account at all by the profiler (and is instead covered in the GPU profiler tab).
Despite the above caveats, the profiler can be used to identify "hot spots" which would be good candidates to attempt to optimise first if there is a performance problem. For more performance advice, see Performance Tips. Note that optimisation is often not necessary and is a waste of time if the project is already running fast enough. For a deeper discussion of the subject, see the blog post Optimisation: don't waste your time.
Profiler breakdown
The profiler shows a table identifying how much CPU time has been spent in each part of the engine, down to individual event groups. It shows both the Self time, which is the time spent in just that item, as well as the Total time, which is the self time plus the time for any sub-items. The total time is mainly applicable for events, since it shows how much time was spent in that item and all its sub-items. For example an event group's self time is the time spent processing the group excluding any sub-groups, and its total time is the time spent processing the group including any sub-groups. By default the table is sorted showing the highest self time at the top, which is normally the best way to identify what needs to be optimised. However you can click the table headers to sort by total time instead.
The top-level items are:
- Events: a breakdown of how much time was spent running event logic in the event sheets used by the layout. This is first broken down in to each event sheet (in case includes were used), and then further down in to groups and nested groups of events. This can help identify the most CPU-intensive events which you may want to optimise.
Note: this category includes time spent running scripts in events.
- Triggers: some triggers, like On mouse clicked, run outside the normal event processing that happens every tick. These are not covered in the Events section, so are included under this item instead.
Note: this category includes time spent running scripts in triggered events.
- Scripts: how much time was spent running scripts in your project. This only covers script files - scripts in events are measured under the Events and Triggers categories. Note: only the time spent in synchronous event callbacks from the engine can be counted. Construct cannot definitively attribute other time spent running your scripts to this category, such as asynchronous code or callbacks outside of the Construct engine. For example code that runs synchronously in the
"tick" event is counted here. However code after an await, or in a setTimeout callback, is not attributed to this category, because Construct is unable to attribute the time spent running script in those cases. It will either be counted under the Engine / Other category, or may not be counted by the CPU profiler at all. If you use this type of code heavily, rely on the profiler in browser's developer tools instead.
- Plugin processing: how much time was spent updating plugins in the engine. Many plugins require a small amount of work to update them every tick, such as for Sprite to advance animations. If there are a large number of instances, this amount of work can become significant. The CPU profiler can also break down this time per plugin to help identify which objects might be contributing most to the plugin processing time.
- Behavior processing: how much time was spent updating behaviors in the engine. Many behaviors require some work every tick to process movement, collisions and so on. If there are a large number of instances, this amount of work can become significant. The CPU profiler can also break down this time per behavior to help identify which objects might be contributing most to the behavior processing time. In particular the Physics behavior is often CPU-intensive as it must run a physics simulation.
- Tweens / Timelines: how much time was spent updating currently running tweens and timelines in the project. This is not normally significant unless you have very large numbers of instances running tweens or timelines.
- Draw calls: how long it took the CPU to issue rendering calls, not including the time for the GPU to complete them. In some cases, rendering calls can be quite CPU intensive, especially when very large numbers of objects are on-screen. Some browsers also forward all draw calls to another thread to be processed in parallel, in which case the Draw calls measurement will likely be an underestimate.
- Engine / Other: the remaining time spent in Construct's runtime engine, which is the overall estimated CPU with the events, scripts, plugin/behavior processing, and draw calls times subtracted away. This covers the general runtime overhead. It sometimes also includes time spent running scripts in your project - see the Scripts category description for more details.