Bugs refer to software defects - things not working as you expected in your project. Debugging refers to the process of fixing these issues. Construct's debugger is a tool to help you find and fix bugs in your project.
The debugger has three tabs: Inspect, Watch Paid plans only, CPU Profiler Paid plans only and GPU Profiler Paid plans only. For more information, see the manual entries for each.
Running the debugger
The debugger appears when you choose the Debug preview mode. This can be reached via the main toolbar, the main menu, the Project Bar or using the keyboard shortcut Ctrl + F5.
The debugger works much like an ordinary preview, except that an extra panel appears alongside the project showing lots of information and some diagnostic tools.
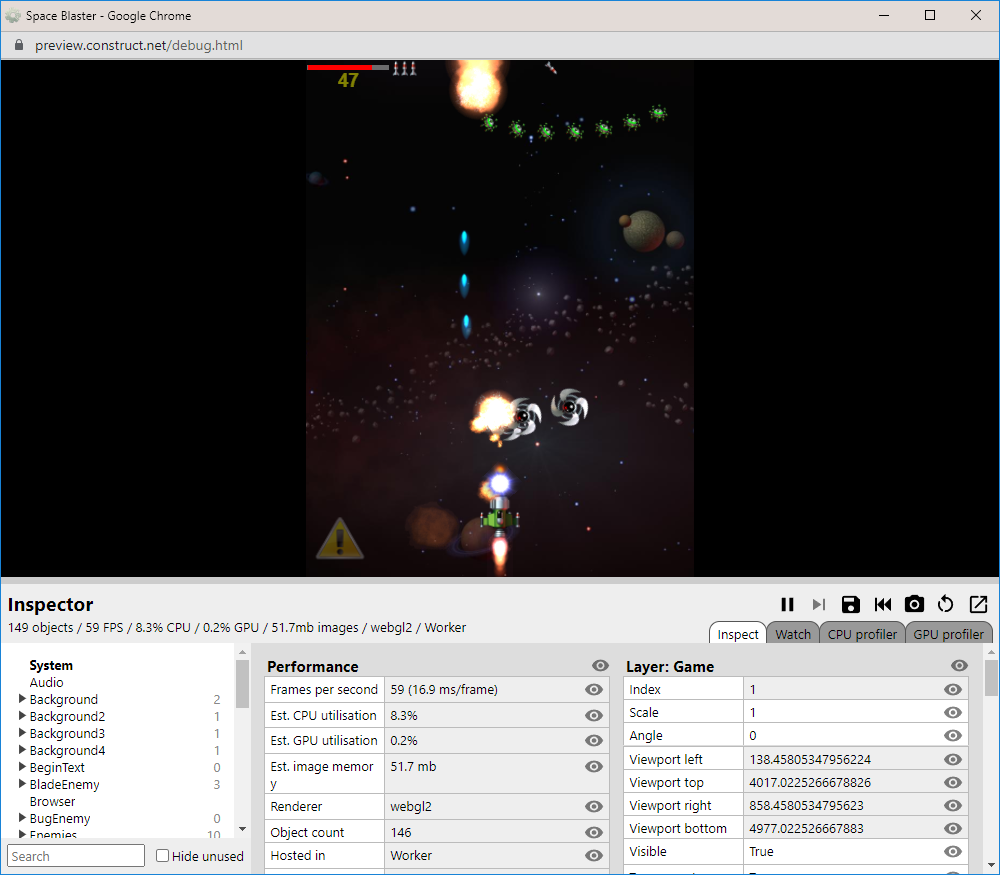 The debugger showing information about the running project
Customising the debugger panel
The debug panel can be resized by dragging the resize border along the top. This allows you to pull it out to see more information, or collapse it down to just its tools and a summary of the performance information.
The debugger can also be popped out in to its own window. This is especially useful on multi-monitor setups. The project will show using the full browser window, and a separate browser window displays the debug panel. Click the pop-out button in the top-right of the debugger panel to do this. Clicking it again, or closing the popup window, will restore the debugger panel to the main browser window again.
Main debugger commands
Alongside the pop-out button are some other useful tools. They are as follows:
- Pause: pause the project so it is no longer progressing. This is useful to spend a while inspecting some information at a particular moment. When paused it turns in to a Resume button; click it again to resume running.
- Step can only be used when paused. It advances the project by a single frame. Delta-time (dt) is set as if the project were running at 60 FPS. This can be useful to inspect a moment frame-by-frame and watch how an event like a collision is handled.
- Save and Load make a temporary save, allowing you to quickly save the state of the project and then restore back to that state at any time later on. This can be useful for repeatedly running the same part of a project over and over again. The state is stored to the current browser's local storage. The save will not be available in a different browser, but will be available in the same browser even after closing and reopening it, rebooting, etc.
- Take screenshot will download a screenshot of the main project view, providing a useful tool to capture images of your project.
- Restart will refresh the project, loading it from scratch again.
Performance summary
Some details about the performance of the project appear in the debugger's main title bar, and in the Inspect tab area for the System object, which is displayed initially. For more advice on performance, see Performance Tips. Note that since the debugger displays and manages a lot of information, it can have a significant performance overhead itself; when measuring performance, it's best to switch to one of the Profiler tabs Paid plans only, or use the normal preview mode and display performance measurements with objects. The performance information the debugger displays includes the following:
- The object count (e.g. 500 objects): how many objects are currently created. Using too many objects can degrade performance. This value corresponds to the objectcount system expression.
- The framerate (e.g. 60 FPS): how many frames per second the project is running at. Most system's displays update at 60 Hz, so the project should run at 60 FPS for optimal rendering. This value corresponds to the fps system expression.
- The estimated CPU time (e.g. 20% CPU): an estimate of how much CPU time is being spent in the logic of the project. This is not always accurate, especially since it only takes in to account time spent on the main JavaScript thread, and should only be considered a ballpark figure. The profiler Paid plans only can break this down in to how much time is being spent in each area of the project, and is described in more detail later on in this guide. This value corresponds to the CPUUtilisation system expression.
- The estimated GPU time (e.g. 20% GPU): an estimate of how much GPU time is being spent in the rendering of the project. This is also an estimate based on hardware timers in the GPU. This value corresponds to the GPUUtilisation system expression.
- The estimated image memory use (e.g. 32.5mb images): an estimate of how much memory is being used by the currently loaded images in the project. Images typically use up the most memory in a project, but note this value excludes everything else, such as memory required to run the logic of the project or to play music and sound effects. See the guide on Memory usage for more information. This value corresponds to the ImageMemoryUsage system expression.
Some additional performance details appear in the Performance section of the System object's inspector view, which is displayed by default:
- Collision checks/sec (e.g. 1144 (~22 / tick)): how many times in the last second the engine had to test for a collision between two objects. Collision checks are invoked by the On collision or Is overlapping sprite conditions, and many behaviors perform additional collision checks automatically. In brackets, the average checks per tick is also shown. For example if there were 600 collision checks in the last second and the framerate is 60 FPS, the estimated checks per tick will be 10. This tells you on average there were about ten collision checks per frame, although the actual value will often vary frame-by-frame.
- Poly checks/sec (e.g. 60 (~1 / tick)): most collision checks are very fast, and the engine can tell trivially that two objects are not overlapping (by verifying that their bounding boxes do not overlap). However if two object's bounding boxes are overlapping, the engine must do a more expensive check where the collision polygons of each object are tested against each other. This value tells how many checks of this kind were made in the last second, as well as with the average per tick as with the Collision checks/sec value. Usually the Poly checks/sec value is considerably smaller, but if it is high, it indicates a possible performance problem.
Breakpoints
When running the debugger, it's possible to set breakpoints to pause execution of an event sheet on a specific event, condition or action. For more information, see the manual entry on breakpoints.